Description
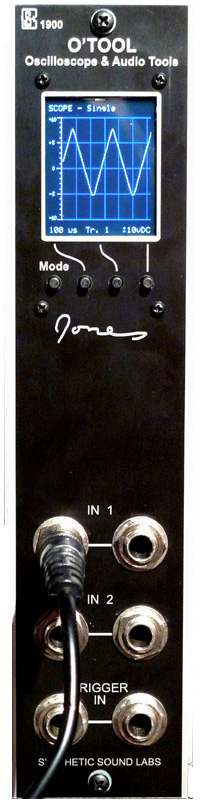
The SSL 1900 is a display module for looking at waveforms and voltages created by other modules.
The O’Tool is a fairly accurate display of waveforms and other audio meters, but it is not as accurate as a full sized oscilloscope, guitar tuner, spectrum analyzer, etc…
In 1 and In 2 are the signal inputs. Trigger In is an external trigger for the oscilloscope modes. It is not used in other modes. Each of the three inputs have two jacks. The pair of jacks are internally connected together, like a two jack Multiples module. Either of the pair of jacks can be used as an input. The other jack can be used like an output to feed the same signal to another module.
The left button (Mode) cycles through the scope and meter modes. The right three buttons select options within a mode.
- Color LCD display
- Input jacks
- Buttons
- Current Mode
- Scope/Meter Display Area
- Current Button Settings
Modes
There are 9 different modes in the O’Tool. Pressing the “MODE” button (the left of the four buttons) cycles through all of the modes. The three right buttons select various options within each mode. The specific setting they change is shown at the bottom of the LCD.
MODE 1: Oscilloscope, single trace
Input 1 is displayed as an oscilloscope trace.
Button 1 = Timebase: 100 µSec to 5 Sec per division
Button 2 = Trigger: in 1, in 2, Ext 0v, Ext 1v, No Trigger
Button 3 = Voltage Scale: +/-10vDC, +/-5vDC, +/-10vAC, 0-10vDC, 0-5vDC
MODE 2: Oscilloscope, dual trace (layered)
Input 1 is displayed as a red oscilloscope trace, while Input 2 is a green trace layered onto the red trace.
Button 1 = Timebase: 100 µSec to 5 Sec per division
Button 2 = Trigger: in 1, in 2, Ext 0v, Ext 1v, No Trigger
Button 3 = Voltage Scale: +/-10vDC, +/-5vDC, +/-10vAC, 0-10vDC, 0-5vDC
MODE 3: Oscilloscope, dual trace (stacked)
Input 1 is displayed as an oscilloscope trace on the top half of the screen while Input 2 is displayed on the bottom half.
Button 1 = Timebase: 100 µSec to 5 Sec per division
Button 2 = Trigger: in 1, in 2, Ext 0v, Ext 1v, No Trigger
Button 3 = Voltage Scale: +/-10vDC, +/-5vDC, +/-10vAC, 0-10vDC, 0-5vDC
The three option buttons function the same in all three oscilloscope modes. The first button cycles through the various timebase settings from 100 µs per division up to 5 seconds per division.
The second button selects the trigger source. When input 1 or 2 are selected, triggering happens when that input rises across the zero volt level for all bipolar (+/-) modes. For unipolar modes (0-10v, 0-5v) the triggering happens when the signal rises past 1.25 volts. When set to Ext 0v, triggering happens as the trigger input rises past zero volts, and Ext 1v triggers when the trigger input rises past 1.25 volts. This allows the external trigger to use a bipolar or unipolar signal independant of the displayed signals.
The third button sets the vertical display range for the scope. DC coupled +/-10v, +/-5v, AC coupled +/-10v, unipolar 0 to 10v DC. or unipolar 0 to 5v DC.
MODE 4: Levels
Input 1 is displayed on the left, while Input 2 is on the right. Green lines represent the percentage of time that that the waveform spends at each voltage level. So, for example a triangle wave shows even shading across the whole range of voltages containing the wave. While a square wave will show a green line at the top and bottom of it’s voltage range, since it spends no time between those voltages. A sine wave will have a subtle shading showing brighter near the top and bottom, where a sine spends more time.
This mode is useful to watch signals change size or bias at a glance without having to look closely at the shape on the scope.
Button 2 = Display speed: Slow (leaves trails), Fast
Button 3 = Voltage Scale: +/-10vDC, +/-5vDC, +/-10vAC, 0-10vDC, 0-5vDC
MODE 5: VU & Peak Meters
Input 1 is displayed on the left of the VU meter and the left of the Peak meter. Input 2 is on the right in both meters.
These are standard VU and Peak meters. 0 dB on the VU meter represents a 1KHz sine at the voltage level selected by button 2. The Peak meter scale is shown in dBu or volts, as appropriate.
There is a thin blue line at 0dBuv and at the selected voltage of the peak meter to make it easier to spot that level at a glance.
Button 2 = Voltage scale: +4dBu (audio line level), +/-2.5v, +/-5v
MODE 6: Spectrum Analyzer
In Linear mode input 1 is on the top, input 2 on the bottom. In Log mode input 1 is on the left, input 2 on the right.
In Linear mode there are many thin vertical bars each representing equal sized frequency steps. The vertical scale of each bar is a linear representation of the voltage level of a sinewave at that frequency. Double the strength is double the height.
In Log mode there are six wide vertical bars each representing twice as many frequencies as the bar before it. The vertical scale of each bar is on a log scale. Double the strength raises the bar 6dB.
Limitations in the CPU limit how many frequencies can show on the screen at once, but by changing the Top Frequency button you can see additional frequency ranges.
Button 1 = Top frequency: 20KHz, 10KHz, 5KHz, 2.5KHz
Button 2 = Display Type: Linear, Log
Button 3 = Magnification: 1x through 64x
MODE 7: XY Display
Input 1 is the X axis (side to side), Input 2 is the Y axis (up and down). The voltages at the two inputs are sampled over time and drawn on the screen. The sampling period is displayed at the top of the screen.
The display is drawn differently depending on the sampling speed. For fast speeds (1ms to 100ms) the inputs are sampled for that period of time and then drawn on the screen at once. For the slower speeds (200ms to 200 seconds) the samples are drawn on the screen as they happen and the oldest sample is removed. This creates sort of a moving snake type of look depending on the speed of the waveforms.
Button 1 = Sample time slower/longer (1ms to 200 seconds)
Button 2 = Sample time faster/shorter (1ms to 200 seconds)
Button 3 = Voltage Scale: +/-10vDC, +/-5vDC, +/-10vAC, 0-10vDC, 0-5vDC
MODE 8: Frequency Meter & Tuner
This can be a single input or both inputs. There are several simultaneous displays. At the top is the frequency in Hz. Below that is the musical note for that frequency. Below that is the number of cents that note is out of tune. Below that is a graphical representation of the number of cents. When the little marker is in the center, the note is exact.
In dual input mode the second input frequency is below input 1. The note for input 2 is on the right. And the graph for its cents is below the graph for input 1.
Please note, this mode was added after the hardware was finished and is not temperature stable, so use it for relative measurements. The two channels are accurate relative to each other, but do not count on it to be accurate to external instruments.
A “User Calibration” mode is available, if you have an accurate frequency source to use as a reference. Follow the instructions on screen after entering that mode. You can also restore the calibration to factory settings from there.
Button 1 = In 1 only, In 2 only, Both inputs
Button 2 = Tuner Calibrated for A4 = 440Hz or 432Hz
Button 3 = Hold for 5 seconds to enter User Calibration mode
MODE 9: Volt Meter
This mode simply displays the average DC voltage for the two inputs. It is averaged over a long period of time for stability, but the value will bounce around if you feed in an AC voltage or oscillation. It is meant for measuring constant DC voltages.

Reviews
There are no reviews yet